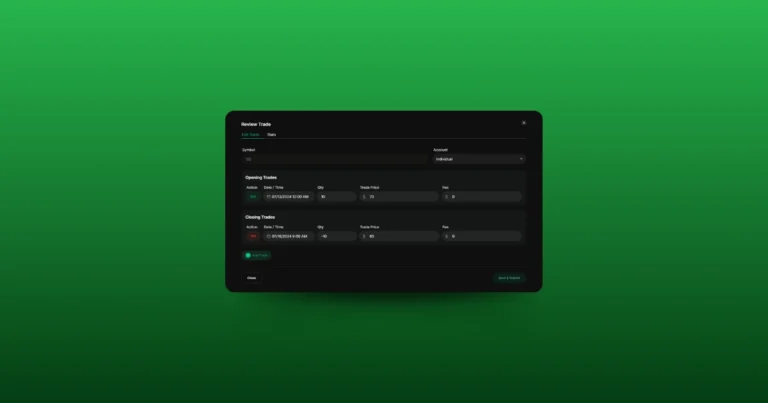
When it comes to trading, timing and tracking are key. The ‘Calendar’ feature in TraderLog makes it easy to see how your trades performed on any given day, helping you identify patterns and improve your overall trading game.
What Does the Calendar Do?
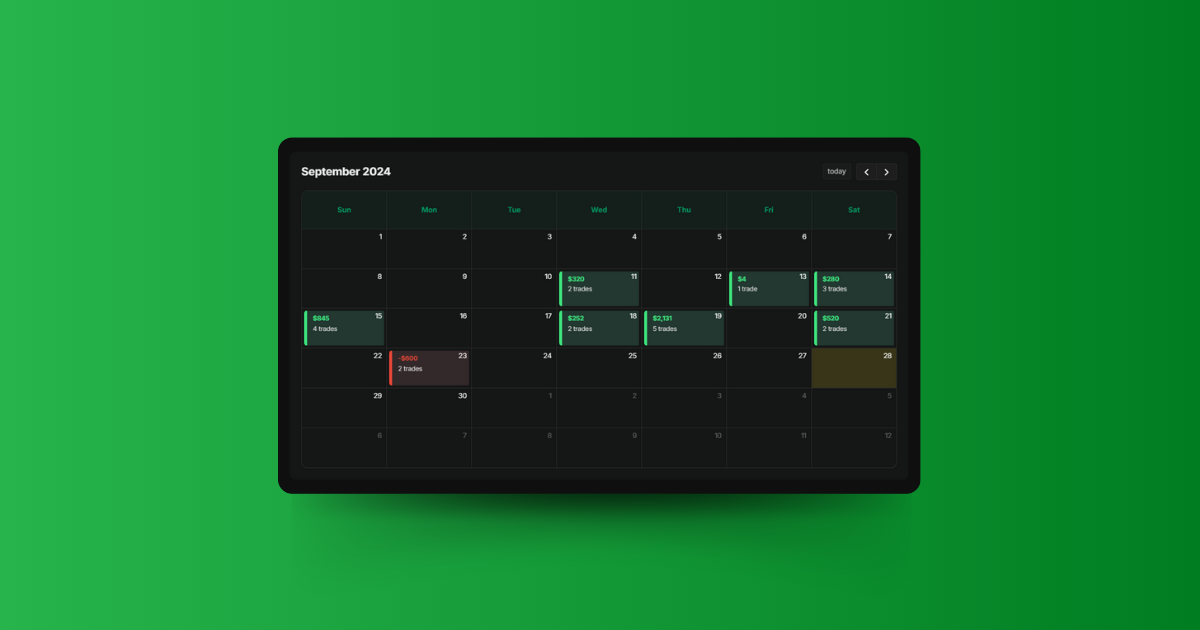
The ‘Calendar’ is designed to give you a quick snapshot of your daily trading performance. Each day you have closed or partially closed trades, you’ll see a simple box in the calendar:
- Total profit or loss for the day
- The number of trades you made
It’s color-coded for ease—green means you had a profitable day, red means you ended up with a loss. This way, you can easily spot trends in your trading activity and track which days worked out well and which ones didn’t.
Dive Deeper with Day Summaries
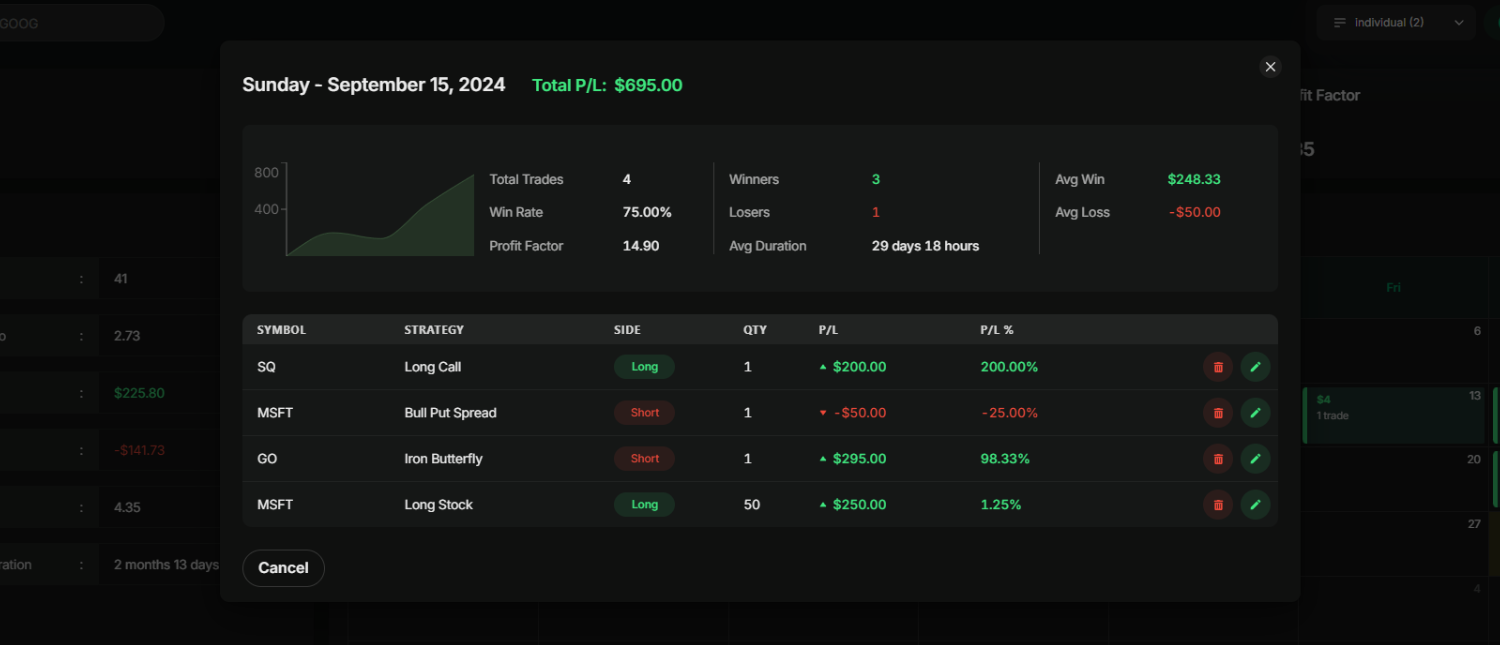
If you want more details on how a specific day went, just click on that day in the calendar. A pop-up window (modal) will open, showing:
- Daily highlights: This includes your total number of trades, total profit or loss, number of winning and losing trades, average win/loss, win rate, profit factor, and average trade duration.
- A mini chart: A quick visual of how your gain/loss played out over the course of the day.
- Detailed trade table: This lists every trade made that day, showing:
- Symbol
- Strategy (e.g., long stock, bear call spread, long future)
- Side (long/short)
- Quantity
- Profit/loss
- Profit/loss percentage
Quick Edits and Trade Management
Sometimes, you may want to tweak your trade details. With the Calendar feature, it’s easy to manage your trades directly from the day’s modal:
- Edit trades: Just click the edit icon next to any trade to adjust parameters like quantity, trade time, price, strike price, or expiration date (for options).
- Delete trades: Need to remove a trade? Hit the delete icon to clear it out.
This makes it simple to keep your trading history clean and accurate.
Optimized for Mobile
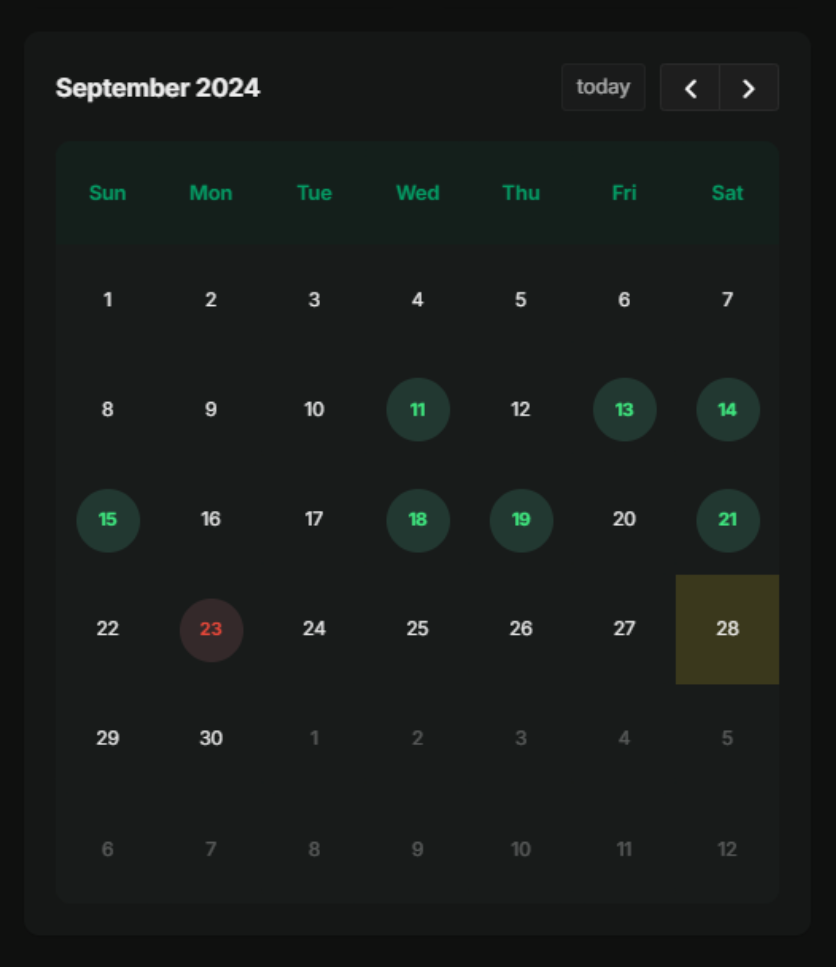
Whether you’re checking your trades from your desktop or on your phone, the Calendar is fully responsive. On smaller devices like smartphones, the calendar adjusts by displaying a small circle around each day—green for profit, red for loss. Tap the circle, and you’ll get the same detailed modal for that day.
