The Avg Win/Loss metric in TraderLog is a ratio that compares the average size of your winning trades to the average size of your losing trades. In simple terms, it shows you whether you’re making more when you win or losing more when you don’t.
A higher ratio means your winning trades are, on average, larger than your losing trades—always a good sign! A lower ratio, on the other hand, could mean your losses are bigger than your wins, which might need some attention.
| How It Helps | Limitations |
|---|---|
| Shows if your wins outweigh your losses, helping you fine-tune your risk management strategy. | Doesn’t factor in the frequency of trades—you could have a high ratio but very few winning trades. |
| Offers a clear, visual representation of your average win/loss sizes, making it easy to spot patterns. | It only shows averages, so it won’t reflect outliers or trades that significantly skew results. |
| Keeps track of performance over time, allowing you to adjust your strategy as your ratio changes. | A high Avg Win/Loss ratio doesn’t guarantee overall profitability—you could still be losing money if your win rate is low. |
How is the Avg Win/Loss Ratio Calculated?
The ratio is calculated using the following formulas:
- Average Win = Total Profit from Winning Trades ÷ Number of Winning Trades
- Average Loss = Total Loss from Losing Trades ÷ Number of Losing Trades
- Avg Win/Loss Ratio = Average Win ÷ Average Loss
This gives you a clear picture of how much you’re winning in comparison to how much you’re losing.
Example 1
Let’s say you’ve made 10 trades, with 6 being profitable. Your winning trades totaled $1,200, and your losing trades resulted in a $600 loss. This gives you an Average Win of $200 ($1,200 / 6) and an Average Loss of $150 ($600 / 4). Therefore, your Win/Loss Ratio is 1.33 ($200 / $150).
This means for every $1 lost, you’re averaging a $1.33 gain, indicating a profitable trading approach.
Example 2
Let’s look at a scenario with 8 trades: 3 wins and 5 losses. The winning trades brought in $450, and the losing trades resulted in a $1,000 loss. This means your Average Win is $150, and your Average Loss is $200. When we divide the Average Win by the Average Loss, we get a Win/Loss Ratio of 0.75.
This ratio implies that for every $1 earned in a winning trade, $1.33 is lost in a losing trade, indicating that losses are dominating the overall performance.
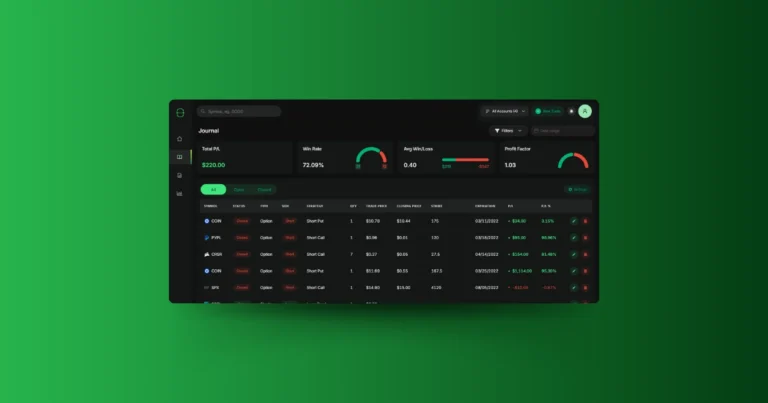
The Avg Win/Loss Metric in TraderLog
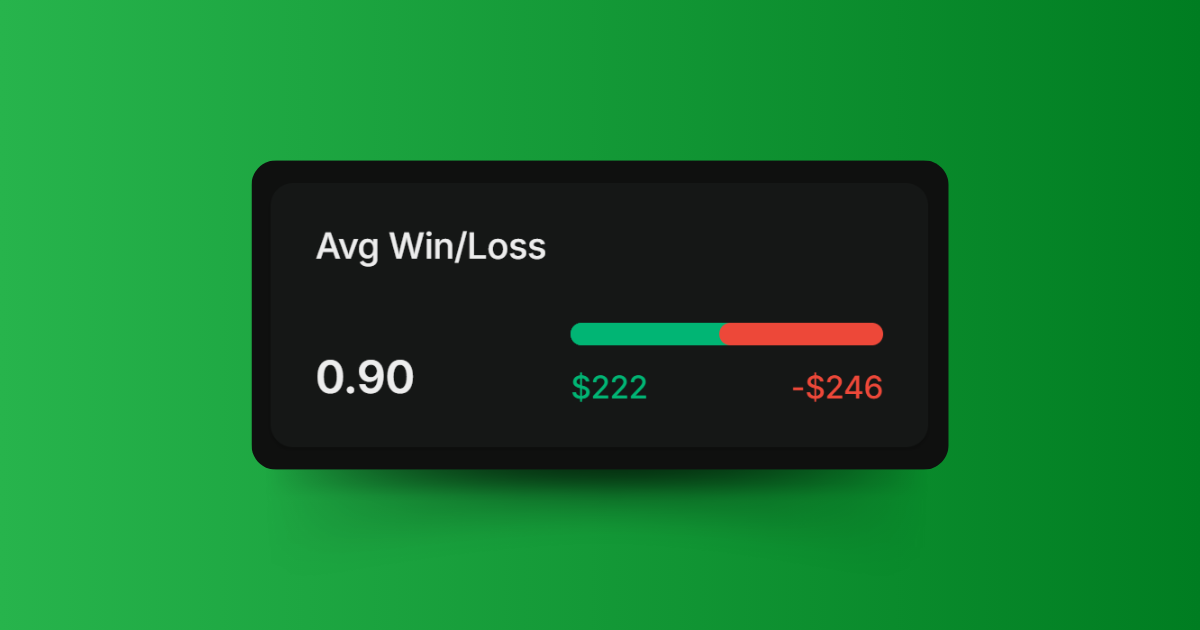
Within TraderLog, the “Avg Win/Loss” metric appears in both the dashboard and journal pages, offering a clear and easy-to-understand visual representation. The window displays the average win and average loss values as well as a color-coded bar.
- Green Bar: Represents the size of the average win.
- Red Bar: Represents the size of the average loss.
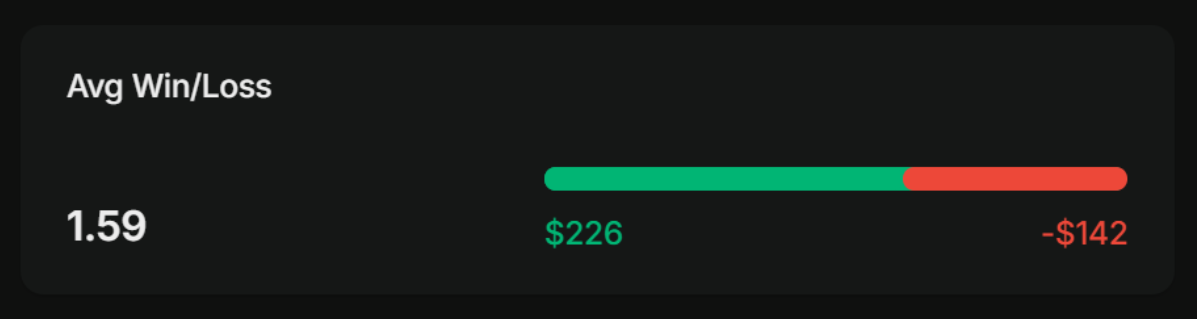
The bar’s width remains constant, but the split between green and red will vary based on the relative size of your average wins versus your average losses. If your average win is larger, you’ll see more green. If your average loss is larger, more of the bar will be red.
For example, if your average win is $200 and your average loss is $100, you’ll see a bar that’s two-thirds green and one-third red. This visual cue helps you quickly grasp whether you’re making more than you’re losing on your trades.