Option Strike Price Explained: What It Is and How It Works
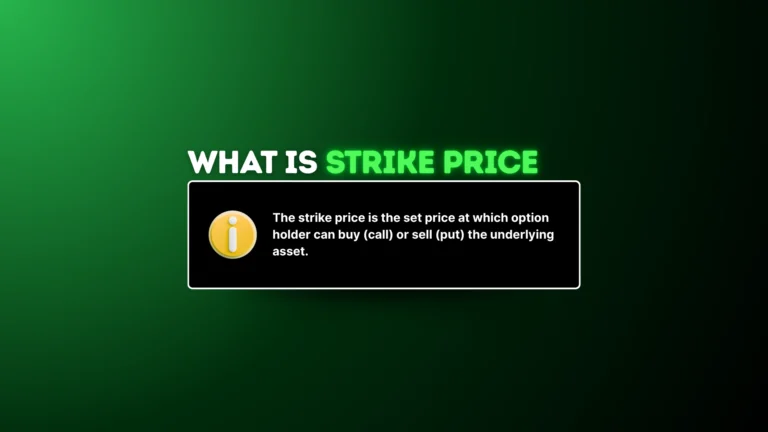
An options strike price is the set price at which an option allows you to buy (in the case of a call) or sell (in the case of a put) the underlying asset. Whether your option ends up profitably depends…