When you’re managing multiple trades across various stocks, options, or other assets, it can be hard to keep track of which symbols are helping or hurting your overall performance. That’s where the Symbol Returns tool comes in. This handy pie chart offers a quick, visual breakdown of how much profit or loss you’ve made on each symbol, as well as other key metrics like ROI and the total number of trades. Let’s dive into how it works and what these numbers really mean for your trading strategy.
How the Symbol Returns Tool Works
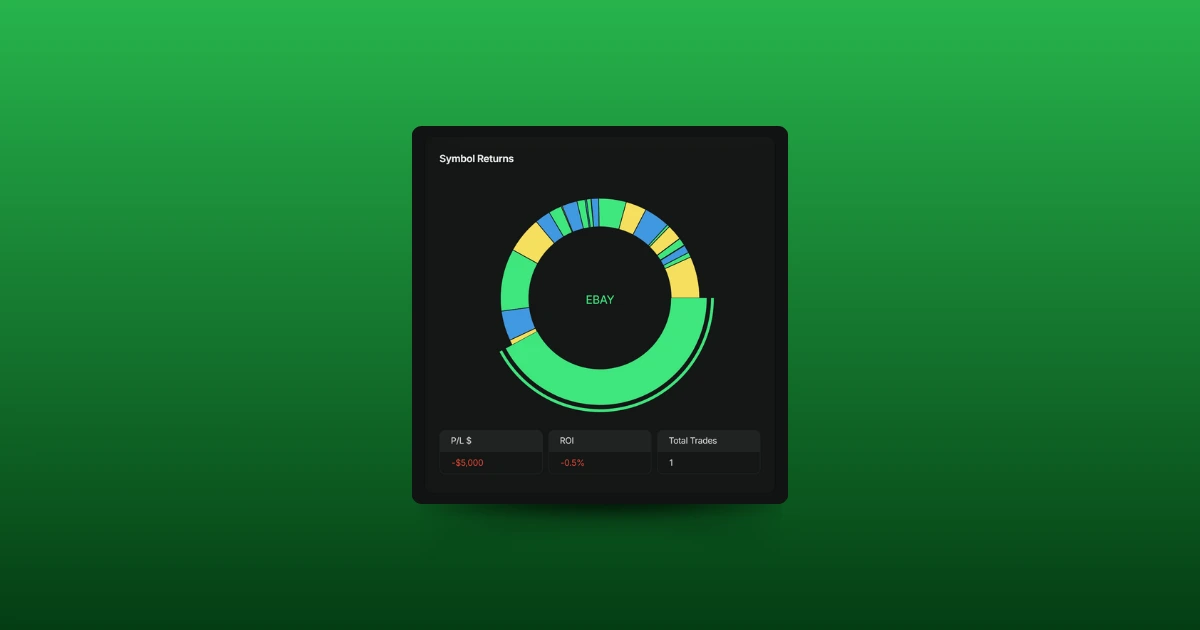
The tool displays a pie chart that breaks down your trading performance by symbol. Each slice of the pie represents a different symbol (such as AAPL, TSLA, SPY, etc.), and the size of the slice corresponds to the total profit or loss you’ve made on that symbol. The chart is interactive, so if you hover over a particular slice, additional details appear just below the pie chart, including:
- Profit/Loss (P/L $): Your net profit or loss on that symbol.
- ROI (Return on Investment): A percentage that shows how much return you’ve generated compared to your initial investment in that symbol.
- Total Trades: The number of trades you’ve executed for that symbol.
This visualization makes it easy to see which symbols are contributing the most to your overall performance, so you can focus on the ones that work best for you.

Breaking Down the Metrics
To help you get the most out of the tool, here’s a quick explainer of the key metrics displayed:
- Profit/Loss (P/L $): This shows your total net earnings (or losses) from trading a particular symbol. It’s the sum of all profits from winning trades minus any losses from losing trades on that symbol. This figure helps you see if a stock or option has been profitable overall, giving you insight into where your strengths (and weaknesses) lie.
- ROI (Return on Investment): ROI is a percentage that reflects how much profit (or loss) you’ve made compared to your total investment in a particular symbol. It’s calculated by dividing your net profit by your total investment and multiplying by 100. A high ROI means you’re getting a good return for your risk, while a negative ROI indicates losses.
- Total Trades: This is the number of trades you’ve placed for a specific symbol. It includes all the times you’ve bought or sold that asset, giving you an idea of how much trading activity you’ve had with each symbol. This number can help you see whether frequent trading on a particular symbol is paying off or if you need to adjust your approach.
Why Use the Symbol Returns Tool?
The ‘Symbol Returns’ tool is a great way to quickly assess your trading performance by asset. Instead of sifting through individual trades or reports, you get a clear, visual summary of how each symbol has impacted your portfolio. This can help you:
- Identify which symbols are your most profitable.
- Spot underperformers that might be dragging down your overall results.
- Understand how your trading activity for each symbol aligns with your broader strategy.


