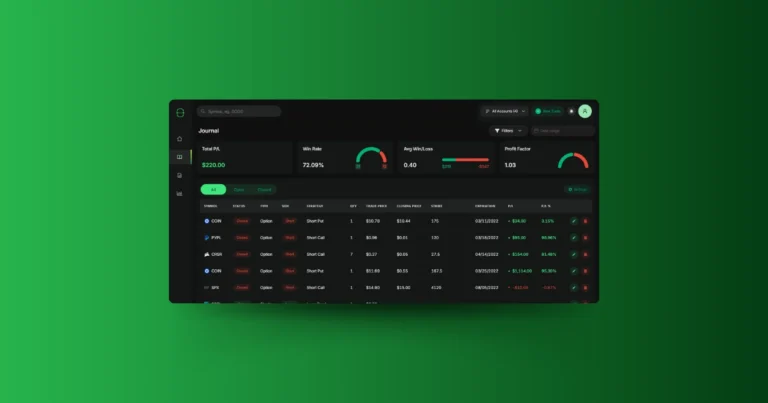
The journal is where you’ll find a table of all your trades. It can be fully customized to include the information you find most useful, such as trade details, profit/loss metrics, and other key data points. This flexibility allows you to tailor the journal to your needs, making it easier to analyze your trading performance.
Overview of the Trading Journal
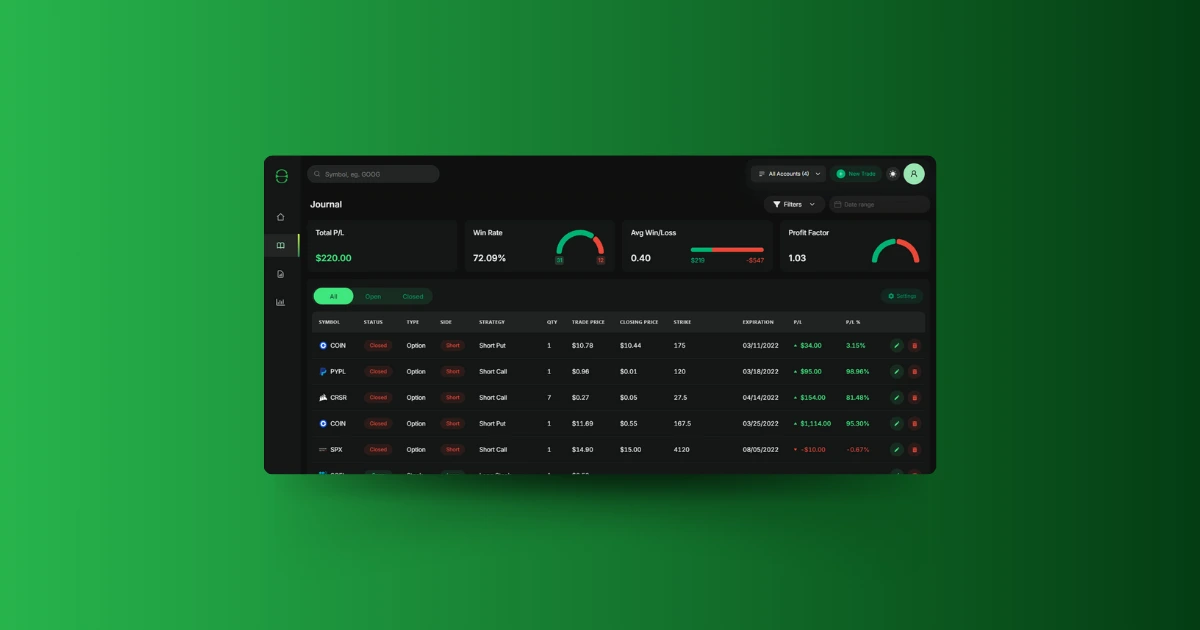
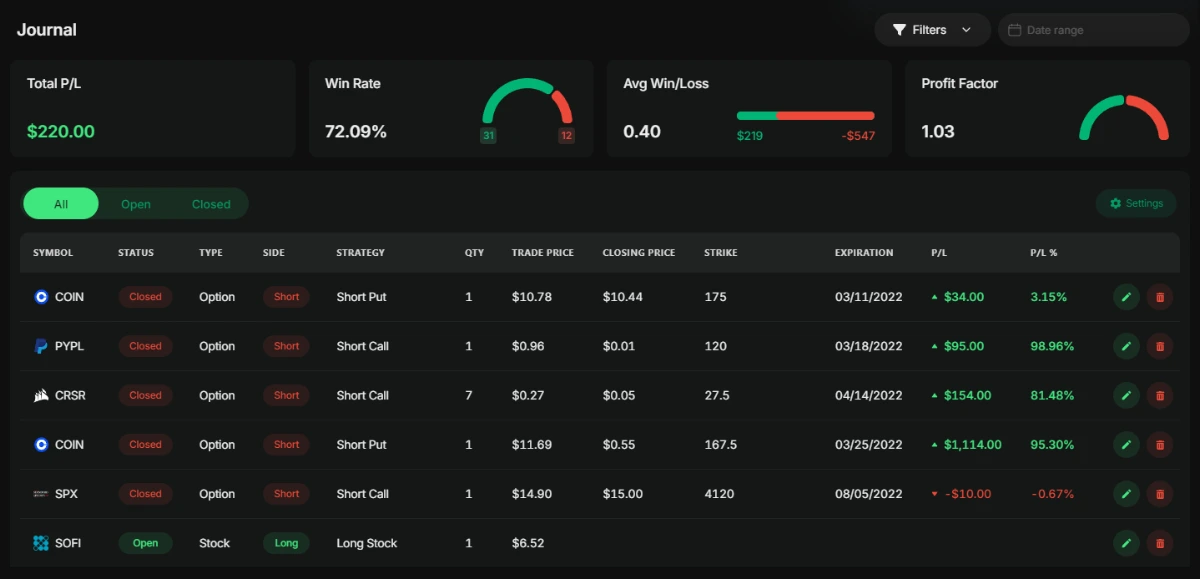
The ‘Trading Journal’ page is where you’ll find every trade you’ve made, all organized in a clean, easy-to-read table. At the top of the page, you can also quickly view key performance metrics such as:
- Total P/L: Your total profit or loss from all trades.
- Win Rate: The percentage of your trades that have been winners.
- Avg Win/Loss: The average amount you make on winning trades compared to what you lose on losing trades.
- Profit Factor: A ratio that compares your gross profits to your gross losses, helping you gauge the overall success of your trading.
Filtering Your Trades
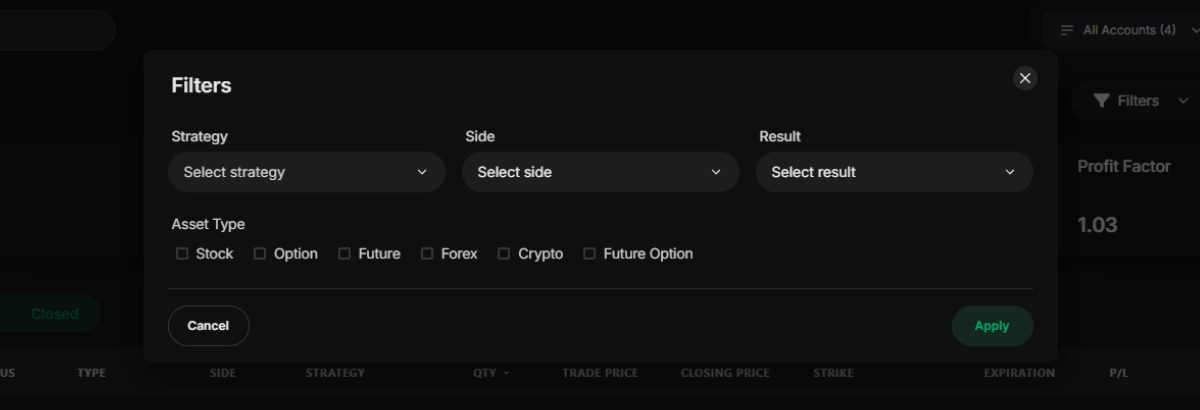
To help you dig deeper into your trades, TraderLog provides several powerful filtering options. By clicking the ‘Filters’ button in the upper-right corner, you can bring up a modal with filtering options. From there, you can filter trades by:
- Strategy: Filter trades based on the trading strategy you used, such as Long Call, Short Stock, Bear Call Spread, etc.
- Side: Choose between ‘Long’ or ‘Short’ trades.
- Result: Filter by winning or losing trades.
- Asset Type: Narrow down by the type of asset, such as stock, option, future, forex, crypto, or future option.
You can also filter trades by time frame using the date range input just to the right of the Filters button, allowing you to focus on a specific period in your trading history.
Customizing the Journal Table
The journal itself is a table that provides a detailed overview of each trade. Here are the columns available:
- SYMBOL: The symbol of the asset you traded (e.g., AAPL, TSLA).
- STATUS: Whether the trade is still open or has been closed.
- TYPE: The type of asset (stock, option, future, etc.).
- SIDE: Whether the trade was long or short.
- STRATEGY: The strategy used for the trade (e.g., Long Call, Short Stock).
- QTY: The quantity of shares, contracts, or units traded.
- TRADE PRICE: The price at which the asset was traded.
- CLOSING PRICE: The price at which you closed the trade.
- STRIKE: For options, the strike price of the contract.
- EXPIRATION: For options, the expiration date of the contract.
- P/L: The total profit or loss on the trade.
- P/L %: The profit or loss expressed as a percentage.
- OPEN DATE: The date the trade was opened.
- CLOSE DATE: The date the trade was closed.
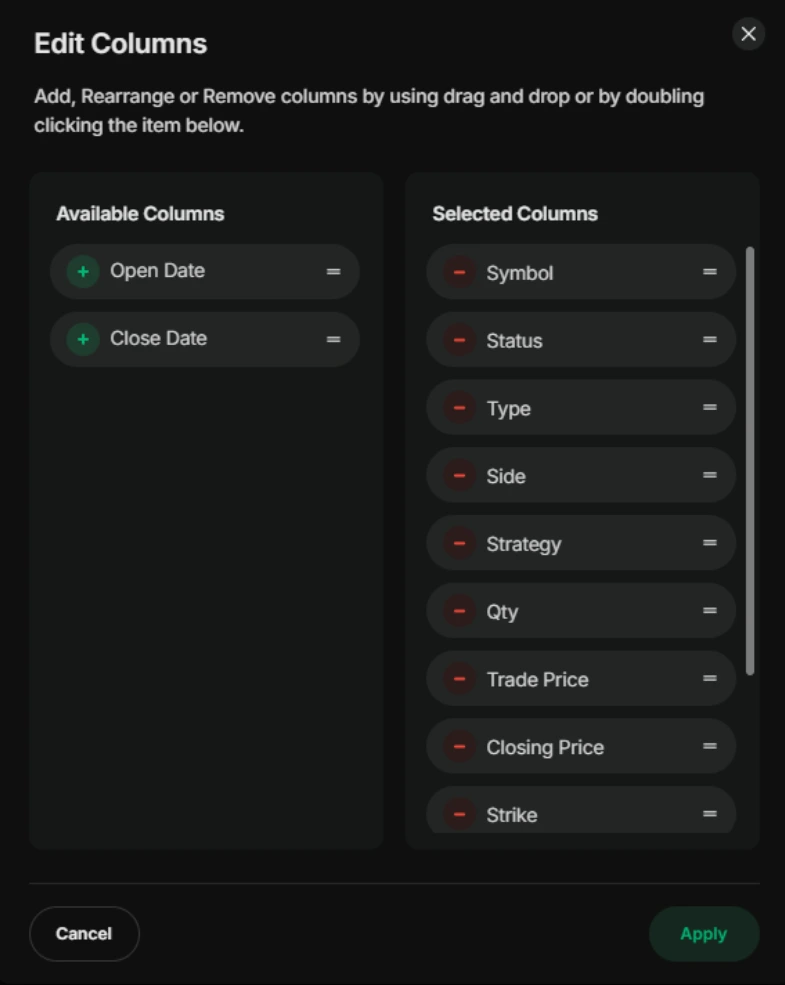
Each of these columns can be clicked to sort your trades in ascending or descending order. Additionally, if you want to customize the table’s layout, you can click the ‘Settings’ button in the upper-right corner. This brings up a menu where you can add, remove, or reorder columns to suit your preferences.
Editing and Managing Trades
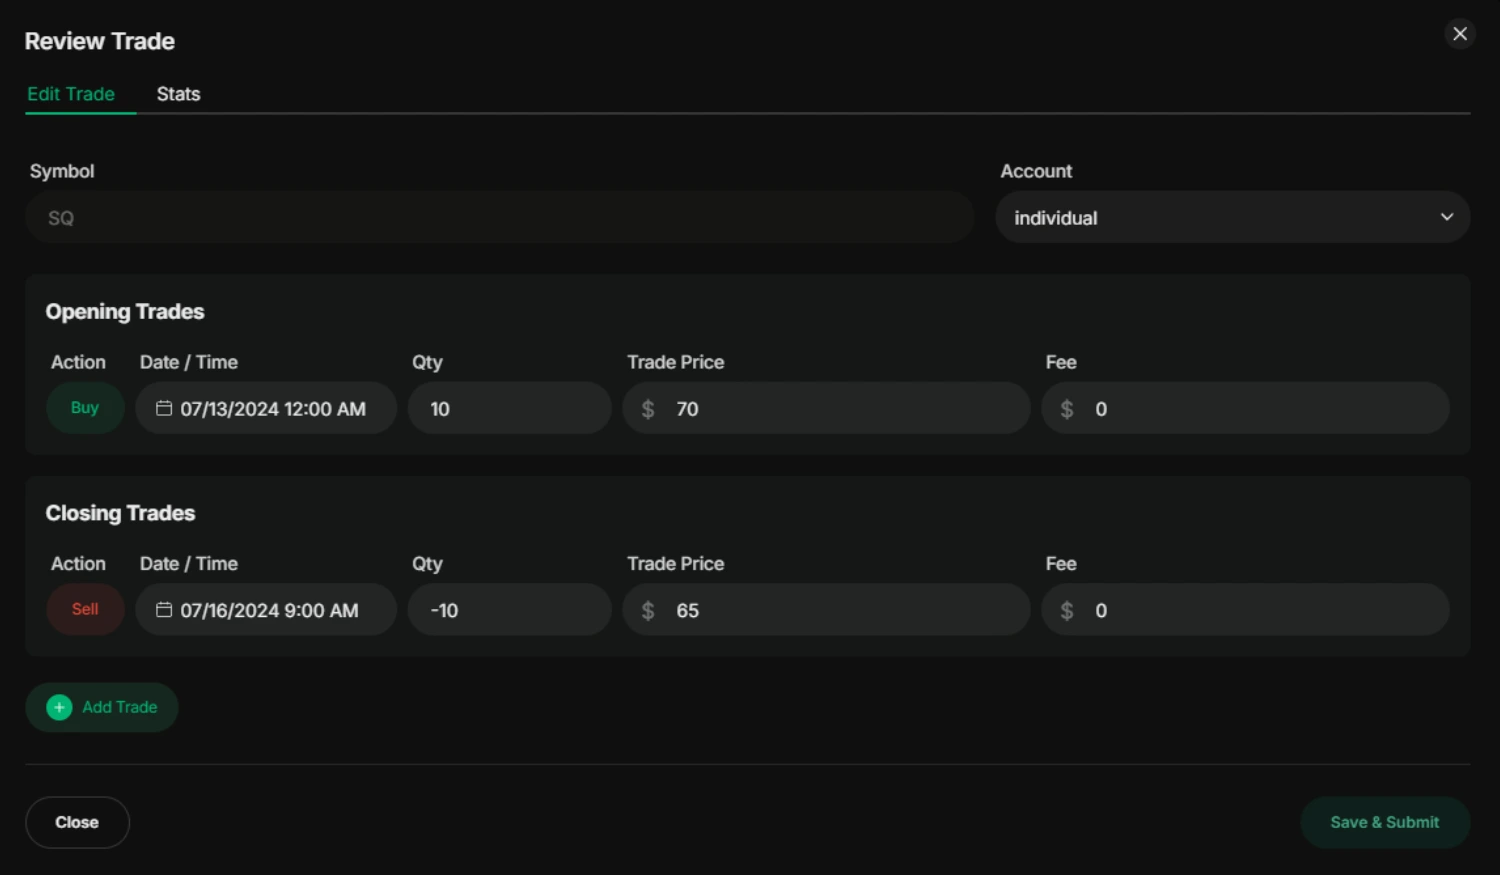
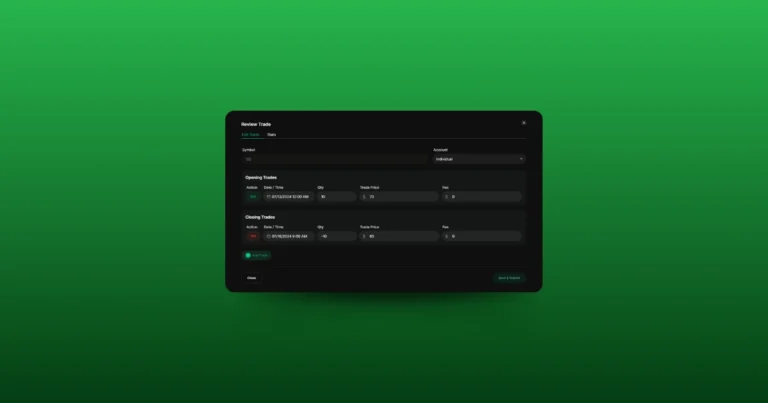
Every trade in the journal comes with the option to edit or delete. Clicking the Edit button opens a window where you can make adjustments to the trade. This window contains all the trade details, such as the action (buy or sell), trade time, quantity, price, fee, and more. If the trade involves options or futures, you’ll also be able to edit inputs like the strike price, expiration date, and option type (call or put).
In addition to these details, there’s a Stats tab in the edit window that shows key metrics about the trade, including:
- Strategy used
- Trade price and total cost
- Total commission
- Trade duration
- Quantity and closing price
- Total exit amount
- ROI and R Multiple (a risk-to-reward measure)
This makes it easy to see how each trade performed in-depth and adjust any details if necessary.
Filtering by Trade Status
You can also filter your trades by their status. Using the drop-down filter, you can choose to view:
- All Trades
- Open Trades: Trades that are still active.
- Closed Trades: Trades that have been fully closed.

